
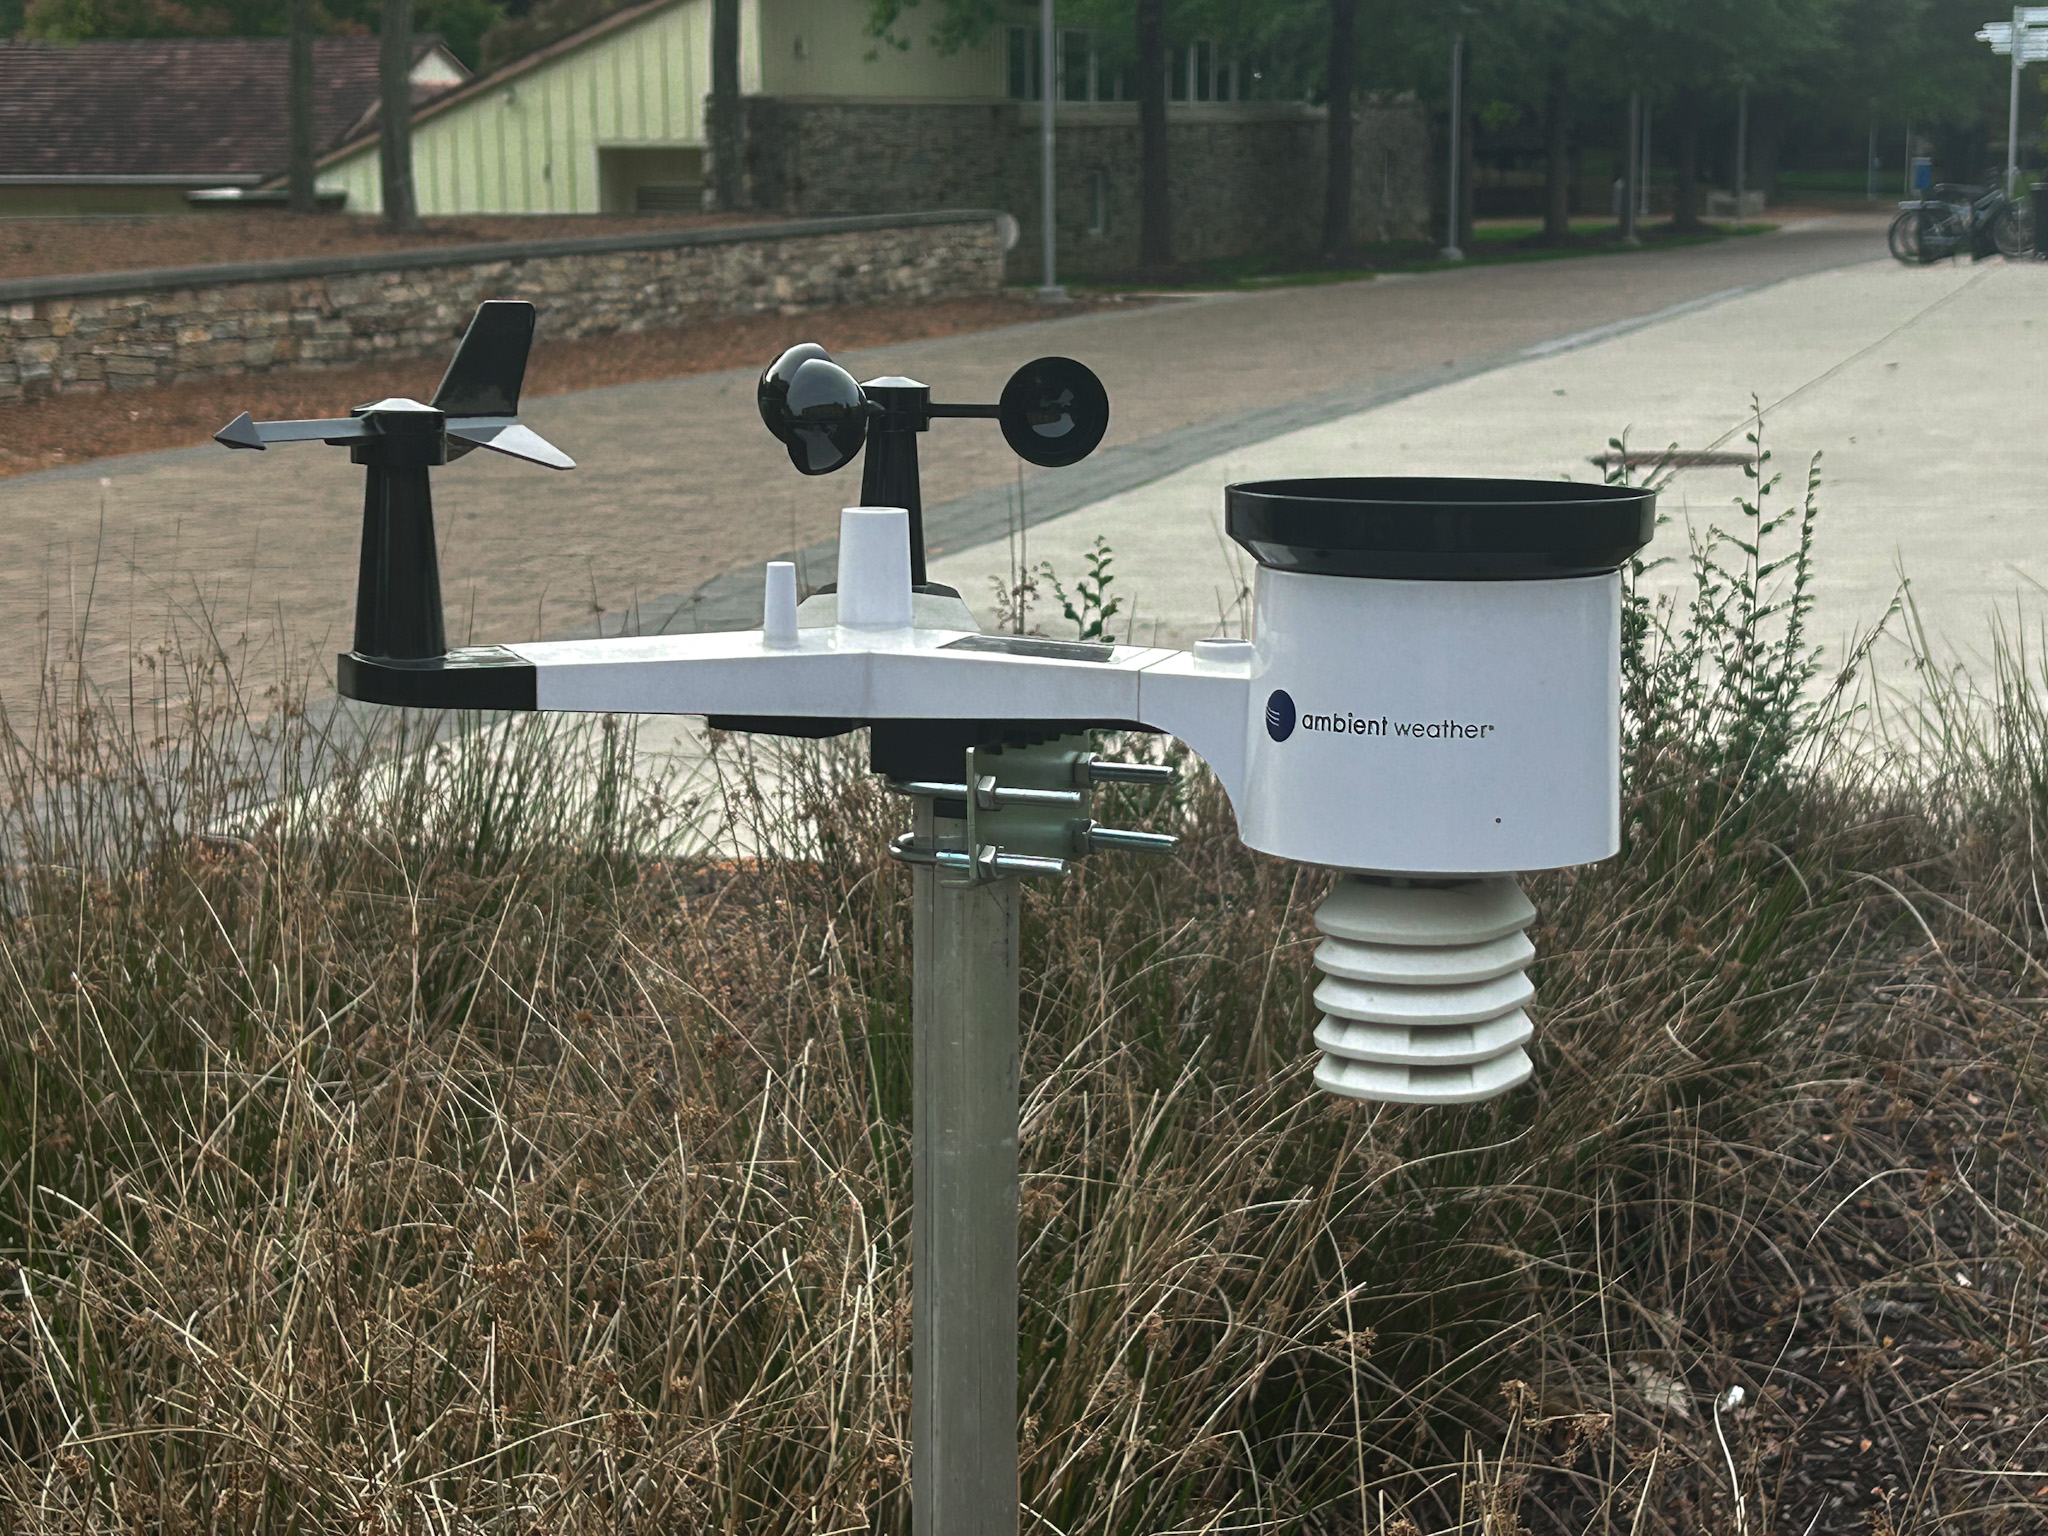
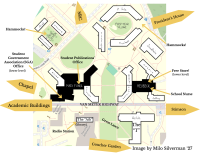
Despite the steady stream of students walking down Van Meter highway everyday, a lot of students look right past one of Goucher’s newest research projects. Standing small and unassuming on the corner between Van Meter highway and the Mary Fisher patio is a small tripod topped in sensors. This tripod, first installed in April of 2026 is a small, wifi-enabled weather station and is part of a much larger research program going on at Goucher.
The sign on the ground in front of the weather station offers some basic information for curious passerby: that it is part of a data science project, that it was installed in partnership with a group called BCWN, and a website link to view the latest data coming in from the station. But the weather station and even the data it helps to collect is the tip of the iceberg for a much more interesting and much farther reaching research project.
Beyond Goucher’s campus, shifting weather conditions such as this year’s super El Niño phenomena and the frequent thunderstorms and nor’easters hitting the East Coast, now is an important time to be watching the weather. It is also an important time for those who normally don’t interact with weather forecasts, to learn more about how weather affects both the day-to-day and long term health on an individual and community basis.
While the term “weather station” often garners imagery of a news anchor in front of a green screen telling you about rain and temperature, small, un-manned ones like the one at Goucher play a huge role in tracking the hyper-local impacts of human infrastructure and predicting long term effects on human health. This data is particularly helpful in mapping the effects of urban heat, which is increasingly significant as 80.7% of the US population lives in urban areas (Source: US Census).
Goucher’s particular weather station is a model called the WS-2902 Smart Weather Station from a brand called Ambient Weather. This particular station allows for the measuring of “wind speed, wind direction, rainfall, UV, solar radiation, barometric pressure, indoor/outdoor temperature (F and C), indoor/outdoor humidity, dew point, heat index, and wind chill,” through an easy to read display and connection over Wi-Fi (Source: Ambient Weather Website).
To find out more about how Goucher ended up with its own weather station, it was important to speak with the professors responsible for it. The professors—Dr. Tom Narock, Dr. Jonathan Lawton, and Dr. Stefanie Kasparek—kindly let a writer from the Quindecim join one of their weekly meetings to ask more questions about the program.
The conversation started out with a tangential discussion about how little students know about research going on on-campus, and how even students and professors involved with research in some capacity, are often unaware of the full scale of research going on at Goucher. Members of the Quindecim had become aware of the weather station during the spring due to a series of pictures sent to the team. Even among the students who submitted the photos and others who were familiar with the weather station, no one seemed to know more than the basic information listed on the sign. Making this yet another research project on-campus, that goes largely unknown by most of the Goucher community.
The project started not on Goucher’s campus, but amongst the Senate legislative offices in Washington, DC. A member of Goucher’s Development Office, Andrea Marsh, was in conversation with the Maryland US Senate legislative offices about the need for data that connected climate change, changing weather patterns, and the effects on public health, especially among vulnerable populations. This conversation turned into an opportunity in which Goucher and Goucher professors were given the chance to lead the research and the quest for this data.
Beyond just being the starting point of the project, Maryland congress people continued to be involved via funding. The program, named the Goucher Outreach Program for Health and Environmental Research (GOPHER) is being funded through a federal grant that was awarded as part of the US Senate Appropriation Committee’s legislation for the 2026 fiscal year. This earmark of $151,000 allowed for not only the start of the research and for the installation of a weather station on Goucher’s campus but for the implementation of several stations across Baltimore County. The official Senate Appropriations website summarizes the reason for the funds as “Support[ing] installation of weather stations and air quality sensors and research tools to fill critical data gaps in urban heat mapping.” (Source: US Senate Appropriations Official Website).
With funding secured, it was time to build the team. The Goucher team is made up of three professors: Dr. Tom Narock, who is a professor of data science, specializing in the application of data science and machine learning to Earth and space sciences; Dr. Jonathan Lawton a professor of public health, specializing in epidemiology, infectious diseases, and bioinformatics; and Dr. Stefanie Kasparek a professor of data science, specializing in the data-driven analysis of international organizations and state actors. Kasparek explained that “everyone has their strengths and their parts to focus on” and that the team works well because they each have their own focus for looking at and analyzing the data.
GOPHER reaches far beyond Goucher’s campus. GOPHER officially partners with the Baltimore Community Weather Network (BCWN) to install weather stations across Baltimore County. This collaboration with BCWN, which is based out of the Baltimore Social-Environmental Collaborative field lab program through Johns Hopkins University, has allowed for Goucher professors to be “bringing our own ideas and our own spin of it” to an existing network, explained Lawton. BCWN describes itself as “a university, city, and community partnership” that has “deployed a network of community-based weather instruments to measure the weather across Baltimore City,” (Source: BCWN Website). In its overview, BCWN specifically emphasizes that its work aims to address the gap in which neighborhoods currently have surface weather measurements and which do not.
Going beyond just formal research, this program brings educational opportunities to people of all ages. One of the next sites set to receive a weather station is Johnnycake Elementary School which is located in the Woodlawn Community of Baltimore County, about 25 minutes from Goucher’s campus. When talking about the upcoming plans for the elementary school Lawton added “if we can get 5th graders to come to school with just 5% more awareness of the environment than before, that would be a win.” Education about the environment in a variety of settings is a key pillar of the program, not just for community members but even for other professors. Narock remarked that he was “not sure people immediately see the connection between weather, climate change, environmental sustainability and all of the downstream impacts on Public Health” while Lawton added that this program is an opportunity for Goucher to put its “money where its mouth is” in terms of sustainability. All three professors echoed that it was an opportunity for Goucher to put its ethos into action, with Kasparek adding that the specific focus on how “changing weather affects vulnerable populations” aligns with Goucher’s mission of social justice.
The program is also directly benefitting Goucher students. The program currently has three student research assistants—one sophomore, one junior, and one senior—who are gaining hands-on research experience and helping with the creation of an abstract that will be presented, by the students, in January.
While the research allows for Goucher to join discussions in the larger community, and allows for some students to get hands-on research experience. There are also some general benefits for the student body: Primarily, the ability to access such local and specific weather data.
The data from Goucher’s weather station can be accessed through one of the Data Science Department’s websites, for people on campus, or through sites like Weather Underground for commuters, professors, or curious parents who live off campus. Upon pulling up the on-campus weather station website (http://datascience.goucher.edu/weather.html) you are met with a series of different data points.
Here is a quick rundown of what all of these terms mean, and how they should affect your choices for the day:
- Temperature, feels like temperature, and dew point: Temperature, which is listed in Fahrenheit due to the college being in the US, describes how hot or cold something is. “Feels Like” temperature is an adjusted temperature that accounts for how temperature is perceived by individuals based on the addition of factors such as wind and the amount of moisture in the air. Dew point describes the amount of moisture the air can absorb before the water comes out of the atmosphere as either fog or rain (Source: National Weather Service). If you are trying to determine how “muggy” it will feel outside, looking at the dew point will be more helpful than looking at the humidity.
- Wind speed and direction: Wind speed is measured by determining the rate at which air is moving past a specific point. In the United States, it is usually measured in miles per hour (mph) or knots per hour which is sometimes written as nautical mile per hour. The strength and frequency of wind affects the perceived temperature of an area.
- Rainfall: Measures the amount of rain in a flat, given area, during a given amount of time. In the United States, it is usually measured in inches. Baltimore gets 30 to 56 inches of rainfall a year (Source: Weather.gov).
- Pressure: Often referred to more specifically as Barometric pressure is the force exerted by the atmosphere on a given point. It is measured in inches of mercury per hour (inHg/hr) which is a slightly different measurement scale than those used to measure air pressure in car tires, or the strengths of hurricanes.
- Humidity: Humidity is a measure of the amount of water vapor in the air.
- UV Index: Is an index that rates the potential harm of being exposed or overexposed to the sun on a given day. The index ranges from 1, which indicates a minimal risk to overexposure, and 11 which indicates a high risk of overexposure (Source: Melanoma Research Alliance).
- Solar Radiation: Measures the power of solar energy (sunshine), in a given spot at a specific point. It is measured in watts per square meter (W/m2).
- Sun and Moon Phase: Shows where in the orbital cycles the sun and moon are. Where the sun and moon are in their cycles affects rise and set times, seasons, and the tides.
For those who want to utilize the data but don’t have the time to get into the details; A quick scroll to the bottom of the page leads you to a “Quick View” section that shows you all of the most important information.
Goucher’s weather station and the GOPHER program allows for people from a variety of backgrounds to engage with weather in all of its wondrous and not-so-wonderous ways. This program is a key example that a lot of research, in Lawton’s words, “seems like good luck but is really hard work and people taking a risk” in order to make things happen.
By Rileigh Ann (RAR) Raspa ’27








Be First to Comment